Search results
Search for "wetting layer" in Full Text gives 24 result(s) in Beilstein Journal of Nanotechnology.
Self-assembly of C60 on a ZnTPP/Fe(001)–p(1 × 1)O substrate: observation of a quasi-freestanding C60 monolayer
Beilstein J. Nanotechnol. 2022, 13, 857–864, doi:10.3762/bjnano.13.76

- ZnTPP directly on the bare Fe(001) surface results in a completely disordered film [47], therefore the passivation of Fe(001) with oxygen is a crucial step to obtain a suitable molecular buffer layer. Since porphyrins molecules lie flat on the Fe(001)–p(1 × 1)O surface, the ZnTPP wetting layer provides
- with previous results [46]. This order extends over large domains (hundreds of square nanometers wide) and tends to disappear as soon as additional molecules are deposited on top of the wetting layer. The formation of a well-ordered ZnTPP film with (5 × 5) periodicity is confirmed by the STM image
- ) unit cell. In the lower right corner, the crystallographic directions are indicated. (a) Large-scale STM image of a C60 wetting layer deposited on C60/Zn-TPP/Fe(001)-p(1 × 1)O. In the left top corner of the image, the ZnTPP layer is visible. (b) Zoomed image of the region marked by a dashed square in


Spontaneous shape transition of MnxGe1−x islands to long nanowires
Beilstein J. Nanotechnol. 2021, 12, 366–374, doi:10.3762/bjnano.12.30

- spontaneous shape transition, from regular islands to elongated nanowires, upon high-temperature annealing of a thin Mn wetting layer evaporated on Ge(111). We demonstrate that 4.5 monolayers is the critical thickness of the Mn layer, governing the shape transition to wires. A small change around this value
- formation of quantum wires [35]. In this method, wires are obtained via epitaxial growth of a strained wetting layer followed by annealing at high temperature. However, only few studies have been dedicated to strain-induced elongation mechanisms leading to the formation of semiconducting nanowires, such as
- report a spontaneous morphology modification, from islands to nanowires, in Mn-rich GeMn nanoparticles. The growth is initiated via reaction of a thin Mn wetting layer, evaporated by MBE, with a Ge(111) substrate. Morphology and microstructure of the NWs have been studied by scanning electron microscopy


Extended iron phthalocyanine islands self-assembled on a Ge(001):H surface
Beilstein J. Nanotechnol. 2021, 12, 232–241, doi:10.3762/bjnano.12.19

- wetting layer on TiO2 [67]. As indicated in Figure 3b, the STM-measured height of the molecular island reaches approximately 1.05 nm. This is in good agreement with previous reports indicating the STM height of an upright-oriented phthalocyanines to be in the range from 1.10 nm [66] to 1.16 nm [67]. This
- , therefore, shall correspond to the half of the unit cells of the α and the β phase. While the majority of phthalocyanines exhibits alternate rotation of the molecules within neighboring columns, there are examples of structures, in which the molecules are rotated uniformly, that is, CuPc on a wetting layer
The influence of an interfacial hBN layer on the fluorescence of an organic molecule
Beilstein J. Nanotechnol. 2020, 11, 1663–1684, doi:10.3762/bjnano.11.149


Analysis of catalyst surface wetting: the early stage of epitaxial germanium nanowire growth
Beilstein J. Nanotechnol. 2020, 11, 1371–1380, doi:10.3762/bjnano.11.121

- possibility to further process the obtained particles as nanocatalysts is verified. The importance of a persistent thin communication wetting layer between the particles and its effects on particle size and number is also clarified here. In particular, the intrinsic reduction of the Laplace pressure of the
- grow germanium nanowires on different substrates is described. Keywords: dewetting; germanium; interfacial energy; Laplace pressure; nanostructure; nanowire; Ostwald ripening; wetting layer; Introduction Wetting phenomena as well as the formation and movement of droplets are essential for numerous
- same behaviour: Gold forms droplets on silicon with a wetting layer between the droplets. The thickness of the wetting layer is approx. 0.28 ± 0.02 nm, at room temperature, and approx. 0.34 ± 0.08 nm at 550 °C, since the zero-crossing of the graphs occurs at these values. Assuming that a gold monolayer


Impact of fluorination on interface energetics and growth of pentacene on Ag(111)
Beilstein J. Nanotechnol. 2020, 11, 1361–1370, doi:10.3762/bjnano.11.120

- the coverage to nominally 48 Å did not significantly change the LEED image (see Supporting Information File 1, Figure S3). This indicated that increasing the coverage does not change the lateral order at the contact layer and pointed towards Stranski–Krastanov growth (island on wetting layer) [70


Hybridization vs decoupling: influence of an h-BN interlayer on the physical properties of a lander-type molecule on Ni(111)
Beilstein J. Nanotechnol. 2020, 11, 1168–1177, doi:10.3762/bjnano.11.101

- large-area STM images (Supporting Information File 1, Figure S2), which confirm a close-packed DBP wetting layer as well as DBP clusters on top for a nominal film thickness of about 1.6 MLE. Hence, there is little discrepancy between 1 MLE, defined via DRS, and a fully covered substrate surface


Electromigration-induced directional steps towards the formation of single atomic Ag contacts
Beilstein J. Nanotechnol. 2020, 11, 680–687, doi:10.3762/bjnano.11.55

- was employed in order to obtain nanostructures of bow-tie shape that were 100 to 200 nm wide at the smallest constriction. After HF dip, in order to get a hydrogen-terminated surface, 1 nm of Ti served as wetting layer before we evaporated 5 nm of Ag onto the substrate at room temperature. Thirdly


CuInSe2 quantum dots grown by molecular beam epitaxy on amorphous SiO2 surfaces
Beilstein J. Nanotechnol. 2019, 10, 1103–1111, doi:10.3762/bjnano.10.110

- called Cu-poor CIS composition, CIS is capable of maintaining its crystalline structure as well as its optoelectronic properties [39]. We interpret this thin layer as a 2D wetting layer (WL) formed during the first steps of growth that transits to 3D nanodots as the growth continues. This WL also appears
- could also be expected from the Cu-poor CIS wetting layer. We would expect the WL to behave as a thin (ca. 1.3 nm) quantum well with a narrow PL emission. However, the TEM analysis is highly localized, and the thickness of the layer could vary in other regions of the sample. To analyse the PL emissions
- in more detail, simple quantum confinement calculations were carried out considering a hard wall spherical QD of radius R and the wetting layer as a hard wall quantum well (QW) of thickness L. The calculations consider the free exciton emission for the QD and QW, respectively. The first transition


Femtosecond laser-assisted fabrication of chalcopyrite micro-concentrator photovoltaics
Beilstein J. Nanotechnol. 2018, 9, 3025–3038, doi:10.3762/bjnano.9.281
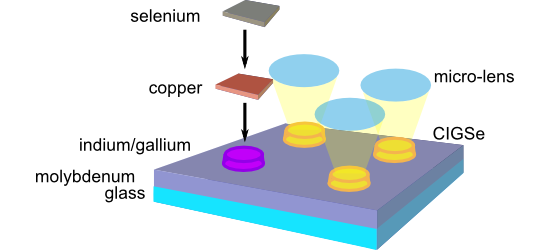
- deposition conditions, such that a significant wetting layer formed in addition to gallium islands. Due to the different temperature dependence of surface mobility and adsorption–desorption equilibria, a sequential PVD process turned out necessary for the growth of (In,Ga) islands, whereby indium islands
- layer was always observed. In order to avoid the undesired formation of a thin CuGaSe2 layer connecting the separate CIGSe islands after processing, this gallium wetting layer was removed by a mild reactive ion etching step in Ar+ plasma. LIFT approach The second approach presented here for the
- were grown first, onto which gallium was subsequently deposited. Optimum gallium deposition conditions were found to be a substrate temperature of ca. 400 °C and a deposition rate of 0.15 Å/s. Despite preferential aggregation of gallium at the existing indium islands, an additional gallium wetting


Variation of the photoluminescence spectrum of InAs/GaAs heterostructures grown by ion-beam deposition
Beilstein J. Nanotechnol. 2018, 9, 2794–2801, doi:10.3762/bjnano.9.261

- : the top with a GaAs strain-reducing layer; the bottom with a strained buffer layer (wetting layer) [15][16][17][18][19]. Thus, the simplified energy band diagram of the active region of an InAs/GaAs heterostructure is an InAs quantum dot built into a GaAs matrix in the form of a quantum well. It
- quantum dot. In the case of using the third method, other mechanisms of optical transitions are possible. The growth of QDs occurs in the Stranski–Krastanov mode, when the substrate wetting layer is elastically stressed. An InAs/GaAs heteropair is ideal for creating conditions for a transition from 2D to
- QD or in the wetting layer. Therefore, the photoluminescence in the grown samples can go through the ground (PLGS) and excited (PLES) states of the electrons at the QDs and also through the energy levels in the wetting layer (PLWL). The measured PL spectra of the vertically stacked QD arrays are


Theoretical study of strain-dependent optical absorption in a doped self-assembled InAs/InGaAs/GaAs/AlGaAs quantum dot
Beilstein J. Nanotechnol. 2018, 9, 1075–1084, doi:10.3762/bjnano.9.99

- nm. The wetting layer is two monolayers. The measured system has been doped with sheet doping of two electrons per dot. The strain controlling layer is made of In0.15Ga0.85As and is sandwiched between two layers of GaAs each with a thickness of 1 nm. Next, there are two layers of Al0.22Ga0.78As, each
- with a base diameter of 20 nm and a height of 5 nm, with a wetting layer of two monolayers. The strain control layer of In0.15Ga0.85As is sandwiched between two 1 nm layers of GaAs, and two 2 nm layers of Al0.22Ga0.78As. The rest of the structure is made of Al0.07Ga0.93As. The atomistic grid of the


Growth model and structure evolution of Ag layers deposited on Ge films
Beilstein J. Nanotechnol. 2018, 9, 66–76, doi:10.3762/bjnano.9.9

- effective permittivity of Ge inclusions embedded in silver with a Ge-to-Ag volume ratio of 1:10, which corresponds to 20 nm thick Ag film deposited on 2 nm thick Ge wetting layer. For these calculations, the permittivity of silver matrix was assumed as the permittivity of 20 nm thick silver layer deposited
- thick Ag films deposited on 2 nm thick Ge wetting layer and capped with 3 nm thick LiF overlayer, measured using spectroscopic ellipsometry 10 days after the deposition process. The black and red curves have been reproduced from [4]. Transmission spectra of non-annealed (left column) and annealed (right
- ) Transmission spectra of Ge/Ag multilayer structure with total thickness of 20 nm. (b) Imaginary part of permittivity for 20 nm thick silver film deposited on 2 nm thick Ge wetting layer, measured using spectroscopic ellipsometry at 1, 10 and 60 days after deposition (solid lines), as well as Maxwell–Garnett


Diffusion and surface alloying of gradient nanostructured metals
Beilstein J. Nanotechnol. 2017, 8, 547–560, doi:10.3762/bjnano.8.59

- dislocations) are difficult to be identified in GNS or SPD metals, it is argued that the GB diffusion might also be accelerated by GB thickening, resulting from either the GB prewetting (premelting) or the pseudo-partial GB wetting during sample preparation [46][47][48][49]. For example, a Zn-rich wetting
- layer of 2–10 nm in thickness has been formed along Al/Al GBs in UFG Al–Zn alloys after high pressure torsion at room temperature [47]. Dramatically enhanced GB diffusivities were observed in Cu–Bi and Fe–Si–Zn alloys with prewetted GBs [48][49]. Nevertheless, this notion might safely be excluded from


Ordering of Zn-centered porphyrin and phthalocyanine on TiO2(011): STM studies
Beilstein J. Nanotechnol. 2017, 8, 99–107, doi:10.3762/bjnano.8.11

- have shown that copper phthalocyanine (CuPc) molecules deposited on rutile (011) could form ordered planar nanostructures up to a complete monolayer coverage. At higher deposition, this wetting layer of planar molecules became covered with 2-dimensional (2D) molecular islands which could be stabilized
- molecular structures were unstable against the STM tip, precluding any high-resolution imaging. It was found, however, that this situation could be greatly improved if the wetting layer of the native CuPc molecules was substituted by Zn(II)meso-tetraphenylporphyrins (ZnTPP) [5]. The present work extends
- diffusion necessary for the observed level of surface ordering. Similar ordering is achieved also for coverages slightly exceeding the monolayer (Figure 1, right panel), with additional bright spots attributed to molecules present on top of the wetting layer. High-resolution STM imaging of the ZnPc


Obtaining and doping of InAs-QD/GaAs(001) nanostructures by ion beam sputtering
Beilstein J. Nanotechnol. 2017, 8, 12–20, doi:10.3762/bjnano.8.2

- 150 eV. The angle of incidence of the beam was equal to 50°. The temperature ranged from 450 to 650 °C. It should be noted that thickness of the InAs wetting layer reaches 1.5–2 ML [34]. InAs/GaAs hut quantum dots contain two extra faces {137} in addition to four main faces {105} [35]. Besides hut
- a single hut QD with a clearly seen wetting layer. With increasing growth an increase of the size of the quantum dots is observed. The average dimensions of InAs dots at temperatures below 500 °C did not exceed 20 nm. It should be noted that the structural transition from hut to dome at a


Scanning probe microscopy studies on the adsorption of selected molecular dyes on titania
Beilstein J. Nanotechnol. 2016, 7, 1642–1653, doi:10.3762/bjnano.7.156

- assume that, in adopting these configurations, the interactions mediated by the π-orbitals of the molecule extending in the direction perpendicular to the molecular plane plays a pivotal role. At monolayer coverage, the molecules form a quasi-ordered wetting layer that includes regions comprising
- comprising molecules that are aligned with the given review. The first system comprises FePc molecules deposited on a monolayer of bipyridine (BiPy) used as a buffer layer [48], and the second is composed of CuPc molecules deposited on a wetting layer made of ZnTPP molecules [49]. The study of the FePc/BiPy
- a wetting layer of ZnTPP molecules deposited on TiO2(011) [49]. We have already discussed the results of experiments on both CuPc and ZnTPP molecules deposited onto rutile surfaces [33][43][56]. In the former case, the CuPc molecules formed a wetting layer of flat-lying molecules on which ordered


Fundamental edge broadening effects during focused electron beam induced nanosynthesis
Beilstein J. Nanotechnol. 2015, 6, 462–471, doi:10.3762/bjnano.6.47

- latter experiments have been carried out at voltages between −12 and +12 V depending on the individual purpose. All AFM-based experiments have been performed in a glove box under inert nitrogen atmosphere, which reduces the H2O wetting layer on the surface, particularly beneficial for high-resolution KFM


Si/Ge intermixing during Ge Stranski–Krastanov growth
Beilstein J. Nanotechnol. 2014, 5, 2374–2382, doi:10.3762/bjnano.5.246

- concentration of about 15 atom %. The Ge distribution in the islands follows a cylindrical symmetry and Ge segregation is observed only in the {113} facets of the islands. The Ge composition of the wetting layer is not homogeneous, varying from 5 to 30 atom %. Keywords: atom probe tomography; germanium islands
- ][2][3][4][5][6][35], the composition and the thickness of the wetting layer (WL) are still under discussion due to Si/Ge intermixing during growth [10][11][25]. In the present work, pulsed laser atom probe tomography (APT) has been used to quantitatively study (at the atomic scale and in the 3D space
- ) and perpendicular to a {113} facet (solid line). In both profiles, the surface wetting layer, with a Ge composition of about 10 atom %, can be observed. In the case of the {111} facet, the Ge concentration in the island is almost constant, at approximately 14 atom %. The {113} facet also exhibits a


UHV deposition and characterization of a mononuclear iron(III) β-diketonate complex on Au(111)
Beilstein J. Nanotechnol. 2014, 5, 2139–2148, doi:10.3762/bjnano.5.223

- same units (see Figure S1 in Supporting Information File 1). The situation is different for STM images corresponding to the saturation coverage, that is, t6 and t7 (see Figure 6). Both samples are characterized by a wetting layer whose dendritic morphology is reminiscent of the second layer disordered
- coverages on top of a wetting layer. The comparison of the experimental topography with DFT-simulated STM images of the pristine Fe(dpm)3 complex, as well as those of two possible fragments, suggests that the observed tetra-lobed features are compatible with the formation of Fe(dpm)2 species on the surface


Cathode lens spectromicroscopy: methodology and applications
Beilstein J. Nanotechnol. 2014, 5, 1873–1886, doi:10.3762/bjnano.5.198

- micrometer-sized Fe3O4 islands on a FeO wetting layer. The combination of spatially-resolved XPS and XAS spectra, along with μ-LEED patterns, allowed the unequivocal identification of the specific iron-oxide phases. From the screening of substrate core-level photoelectrons, the thickness of the micrometer
- . In the above example of FeOx growth on Ru(0001), further oxidation by using NO2 as atomic oxygen source resulted in the transformation of the FeO wetting layer to hematite (α-Fe2O3) and the triangular Fe3O4 islands to maghemite (γ-Fe2O3) [71]. In an independent study, the real-time observation of
- islands and the FeO wetting layer on Ru(0001). Top panels show the island and magnetization distribution within a region of 30 μm diameter, illuminated homogeneously by vertically scanning the photon beam during acquisition. Bottom panels


Exploring the retention properties of CaF2 nanoparticles as possible additives for dental care application with tapping-mode atomic force microscope in liquid
Beilstein J. Nanotechnol. 2014, 5, 36–43, doi:10.3762/bjnano.5.4

- particles. This correlation between energy dissipation and deflection angle was observed for all three kinds of nanoparticles investigated. Manipulation experiments in liquid have the advantage, compared to measurements in ambient, that the retention of adsorbed particles in not dominated by the wetting
- layer (hydrodynamic drag of water layer), but the intrinsic particle–sample interaction energies. The frequency distribution of the calculated power dissipated for each of the particles enables us to examine the chemical affinity between the calcium fluoride nanoparticles adsorbed on mica and on


Molecular-resolution imaging of pentacene on KCl(001)
Beilstein J. Nanotechnol. 2012, 3, 186–191, doi:10.3762/bjnano.3.20

- organic electronic devices [13]. The adsorption of pentacene on various substrates has been investigated with diffraction methods and STM [14][15][16][17][18]. On single crystalline metal surfaces such as, e.g., Cu(110), Au(111) and Ag(111) [19][20][21][22][23][24], pentacene forms a wetting layer of flat


Dense lying self-organized GaAsSb quantum dots on GaAs for efficient lasers
Beilstein J. Nanotechnol. 2011, 2, 333–338, doi:10.3762/bjnano.2.39

- ]. These samples were grown at a temperature of T ≈ 500 °C. So far, photoluminescence (PL) signals of SK-grown GaSb QDs on GaAs have emerged at a wavelength between 1.0 and 1.3 µm [7][9]. The interface between the GaAs buffer and the GaSb QDs can cause a wetting layer, which will lead to an additional PL
- attributed to a possible wetting layer could not be identified. An electrically pumped QD laser was grown with an active region consisting of eight layers of QDs and an emission wavelength of λ ≈ 0.900 µm. Results and Discussion Growth procedure and dot characterization All samples were grown on (001) GaAs
- , relating to a wetting layer or otherwise, was observed. For a V/III ratio of 1/1 (smaller dots) the PL peak was at λ ≈ 0.887 μm for a growth temperature of T = 527 °C and a nominal coverage of 3 ML. The dots grown with a V/III ratio of 1.5/1 (larger dots) exhibited a PL peak at λ ≈ 1.035 μm and a smaller


